

2024 Annual Report
OVERVIEW
A New Era: Redefining the Future of Water Management
2024 Annual Report
Leadership
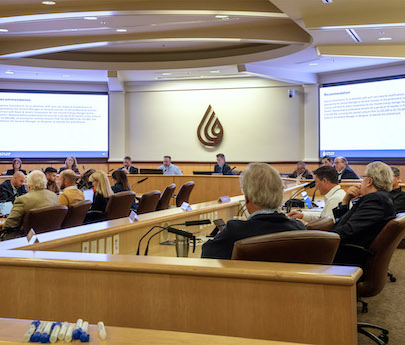
With new leadership at the helm, the Water Authority is focused on fostering a stable, collaborative approach to regional water management. During the last fiscal year, General Manager Dan Denham and an experienced team worked to balance rate stability, secure critical resources, and build partnerships to address ongoing water challenges. Initiatives including landmark water-saving agreements and strategic rate measures reflected a proactive stance on maintaining financial and environmental sustainability, ensuring reliable water service in an era marked by both climatic and economic shifts.
Dan Denham Appointed Water Authority General Manager
In August 2023, the Water Authority’s Board of Directors voted unanimously to appoint Dan Denham as general manager, succeeding Sandra L. Kerl, who retired two months earlier. Denham served the Water Authority for 17 years before he was appointed general manager, including a stint as deputy general manager, where he managed crucial programs such as the Metropolitan Water District and Colorado River initiatives. He also managed significant water transfer projects and played a key role in environmental and legislative advocacy efforts. Prior to joining the Water Authority, Denham served in various capacities at the City of San Diego. Denham’s priorities include enhancing relationships with member agencies, minimizing rate increases, resolving ongoing litigation with the Metropolitan Water District, and securing long-term water supplies for San Diego County. Denham committed to building on the Water Authority’s many achievements and addressing future challenges to ensure the continued stability of the region’s water system.

New Leadership Team Supports Board, GM Vision
As part of the new era in Water Authority leadership, General Manager Dan Denham assembled a new leadership team to guide the agency through a time of unprecedented change. These highly qualified leaders are pioneers in each of their respective fields:

Tish Berge, Deputy General Manager/Chief Operating Officer
LEARN MORE

Jamie Bradford, Assistant General Manager
LEARN MORE

Neena Kuzmich, Director of Engineering
LEARN MORE

Jeff Stephenson, Director of Water Resources
LEARN MORE

Meena Westford, Director of Strategic Initiatives
LEARN MORE

Catherine Love, Director of Human Resources
LEARN MORE

Mike Lee, Director of Public Affairs
LEARN MORE

Jason Foster, Director of Administrative Services
LEARN MORE

Lisa Marie Harris, Director of Finance
LEARN MORE

Eva Plajzer, Director of Operations & Maintenance
LEARN MORE
Tish Berge, Deputy General Manager/Chief Operating Officer
LEARN MORE
Jamie Bradford, Assistant General Manager
LEARN MORE
Neena Kuzmich, Director of Engineering
LEARN MORE
Jeff Stephenson, Director of Water Resources
LEARN MORE
Meena Westford, Director of Strategic Initiatives
LEARN MORE
Catherine Love, Director of Human Resources
LEARN MORE
Mike Lee, Director of Public Affairs
LEARN MORE
Jason Foster, Director of Administrative Services
LEARN MORE
Lisa Marie Harris, Director of Finance
LEARN MORE
Eva Plajzer, Director of Operations & Maintenance
LEARN MORE
Finance
The Water Authority focused on partnerships and innovative strategies to mitigate rising costs across the board in FY24, minimizing financial impact to ratepayers while maintaining the stability of the region’s water supply. A landmark agreement with the Imperial Irrigation District and Metropolitan Water District of Southern California contributed to both significant cost savings and larger conservation efforts on the Colorado River.
Top Stories in Finance

Water Authority Joins Partners for Major Money-Saving Water Transfer
LEARN MORE

Second Straight Wet Year Drives Down Water Sales
LEARN MORE
Board Approves Rate Increase to Cover MWD’s Rising Costs
LEARN MORE

Agreement Allows for Fallbrook-Rainbow Detachment
LEARN MORE
STATEMENT OF REVENUES, EXPENSES, AND CHANGES IN NET POSITION
| Operating Revenues | 2024 | 2023 |
|---|---|---|
| Water Sales | 598,596,228 | 624,080,766 |
| Other Revenues | 581,290 | 1,710,670 |
| Total Operating Revenues | 599,177,518 | 625,791,436 |
| Operating Expenses | 2024 | 2023 |
|---|---|---|
| Cost of Sales | 476,261,911 | 530,364,458 |
| Operations and Maintenance | 29,380,479 | 25,572,960 |
| Planning | 9,600,937 | 9,119,243 |
| General and Administrative | 24,236,082 | 21,458,830 |
| Total Operating Expenses | 539,479,409 | 586,515,491 |
| Net Operating Income before Depreciation and Amortization | 59,698,109 | 39,275,945 |
| Depreciation and Amortization | 66,812,721 | 66,333,231 |
| Operating Income (Loss) | (7,114,612) | (27,057,286) |
| Nonoperating Revenues (Expenses) | 2024 | 2023 |
|---|---|---|
| Property Taxes and In-lieu Charges | 19,935,864 | 18,670,817 |
| Infrastructure Access Charges | 48,230,322 | 47,418,366 |
| Investment Income (Loss) | 16,891,197 | 9,187,160 |
| Settlement Proceeds | 8,506,750 | 411,888 |
| Grant Revenues | 15,844,515 | 5,958,728 |
| Desalination Shortfall Revenues | 6,709 | 4,353,119 |
| Other Income | 366,336 | 255,967 |
| Intergovernmental | 12,982,212 | 12,816,816 |
| Gain (Loss) on Sale/Retirement of Capital Assets | 292,067 | (5,712,848) |
| Gain on In-Substance Defeasance | 385,455 | - |
| Interest Expense | (74,820,877) | (80,915,023) |
| Debt Issuance Costs | (134,039) | - |
| Settlement Rebate to Member Agencies | - | (411,888) |
| Grant Expenses | (16,123,393) | (6,650,036) |
| Project Expenses Write-Off | (7,669,261) | (24,182,391) |
| Other Expenses | (9,179,579) | (5,186,875) |
| Total Nonoperating Revenues (Expenses) | 15,514,278 | (23,986,200) |
| Income (Loss) Before Capital Contributions | 8,399,666 | (51,043,486) |
| Capital Contributions | 2024 | 2023 |
|---|---|---|
| Capacity Charges | 18,789,425 | 21,054,200 |
| Water Standby Availability Charges | 11,282,060 | 11,215,611 |
| Contributions in Aid of Capital Assets | 2,464,639 | 8,885,318 |
| Total Capital Contributions | 32,536,124 | 41,155,129 |
| Income (Loss) Before Extraordinary Item | 40,935,790 | (9,888,357) |
| Impairment of Intangible Asset | - | (36,538,760) |
| Changes in Net Position | 40,935,790 | (46,427,117) |
| Net Position at Beginning of Year | 1,563,579,553 | 1,610,006,670 |
| Net Position at End of Year | 1,604,515,343 | 1,563,579,553 |
STATEMENT OF NET POSITION
| Assets | 2024 | 2023 |
|---|---|---|
| Current Assets: | ||
| Cash and Investments | 133,742,304 | 153,102,577 |
| Restricted Cash and Investments | 114,620,923 | 61,460,631 |
| Water Receivables | 121,079,730 | 105,865,746 |
| Interest Receivable | 1,555,600 | 1,681,545 |
| Taxes Receivable | 1,245,332 | 1,261,361 |
| Other Receivables | 11,000,325 | 13,529,953 |
| Inventories | 150,548,276 | 98,103,617 |
| Prepaid Expenses | 2,358,743 | 3,862,726 |
| Total Current Assets | 536,151,233 | 438,868,156 |
| Noncurrent Assets | 2024 | 2023 |
|---|---|---|
| Cash and Investments | 82,295,778 | 88,065,762 |
| Restricted Cash and Investments | 35,632,198 | 112,040,993 |
| Advances to Other Agencies | 7,303,651 | 11,575,149 |
| Retention Receivable | 1,741,474 | 1,822,389 |
| Long-Term Loan Receivables | 7,470,289 | 7,809,847 |
| Net OPEB Asset | 1,393,012 | 1,703,953 |
| Capital Assets: | ||
| Non-Depreciable | 140,066,072 | 106,622,732 |
| Depreciable | 3,181,341,404 | 3,240,282,527 |
| Total Noncurrent Assets | 3,457,243,878 | 3,569,923,352 |
| Total Assets | 3,993,395,111 | 4,008,791,508 |
| Deferred Outflows of Resources | 2024 | 2023 |
|---|---|---|
| Deferred Loss on Refunding | 5,206,658 | 6,045,662 |
| Pension Contributions Subsequent to Measurement Date | 9,782,792 | 9,999,202 |
| OPEB Contributions Subsequent to Measurement Date | - | 293 |
| Deferred Actuarial Amounts Related to Pensions | 18,692,809 | 16,783,942 |
| Deferred Actuarial Amounts Related to OPEB | 1,240,633 | 1,238,287 |
| Total Deferred Outflows of Resources | 34,922,892 | 34,067,386 |
| Liabilities | 2024 | 2023 |
|---|---|---|
| Accounts Payable and Other Liabilities | 106,439,383 | 94,779,014 |
| Interest Payable | 17,681,987 | 18,062,993 |
| Construction Deposits | 177,177 | 342,448 |
| Short-Term Liabilities | 245,000,000 | 245,000,000 |
| Current Portion of Long-term Liabilities | 73,434,364 | 61,692,290 |
| Unearned Revenue | 6,075,716 | 7,984,051 |
| Total Current Liabilities | 448,808,627 | 427,860,796 |
| Noncurrent Liabilities | 2024 | 2023 |
|---|---|---|
| Long-term Liabilities | 1,878,080,392 | 1,962,492,349 |
| Net Pension Liability | 90,512,623 | 81,836,796 |
| Total Noncurrent Liabilities | 1,968,593,015 | 2,044,329,145 |
| Total Liabilities | 2,417,401,642 | 2,472,189,941 |
| Deferred Inflows of Resources | 2024 | 2023 |
|---|---|---|
| Deferred Gain on Refunding | 5,784,030 | 6,329,298 |
| Deferred Actuarial Amounts Related to Pensions | 197,912 | 321,697 |
| Deferred Actuarial Amounts Related to OPEB | 419,076 | 438,495 |
| Total Deferred Inflows of Resources | 6,401,018 | 7,089,490 |
| Net Position | 2024 | 2023 |
|---|---|---|
| Net Investment in Capital Assets | 1,262,555,471 | 1,228,424,761 |
| Restricted for Construction Projects | 13,107,206 | 21,024,338 |
| Restricted for Debt Service | 1,088,102 | 834,037 |
| Restricted for Net OPEB Asset | 1,393,012 | 1,703,953 |
| Unrestricted | 326,371,552 | 311,592,464 |
| Total Net Position | 1,604,515,343 | 1,563,579,553 |
CASH AND INVESTMENTS
| As of June 30, 2024 and 2023, Restricted Cash and Investments Balances Were as Follows | 2024 | 2023 |
|---|---|---|
| Debt Service Reserve | 22,934,025 | 22,679,650 |
| CIP/Bond Construction | 114,620,924 | 130,284,403 |
| Pay-As-You-Go | 12,698,172 | 20,537,571 |
| Total | 150,253,121 | 173,501,624 |
| As of June 30, 2024 and 2023, Unrestricted Cash and Investments Balances Were as Follows | 2024 | 2023 |
|---|---|---|
| Operating | 134,922,231 | 160,946,414 |
| Rate Stabilization | 78,540,740 | 78,540,740 |
| Canal Maintenance | 712,665 | 484,147 |
| Equipment Replacement | 1,862,446 | 1,197,038 |
| Total | 216,038,082 | 241,168,339 |
| Total Cash and Investments | 366,291,203 | 414,669,963 |